- Home
- Support Options
- On-line Support
- Using the Software
- Dashboard Layout Diagram
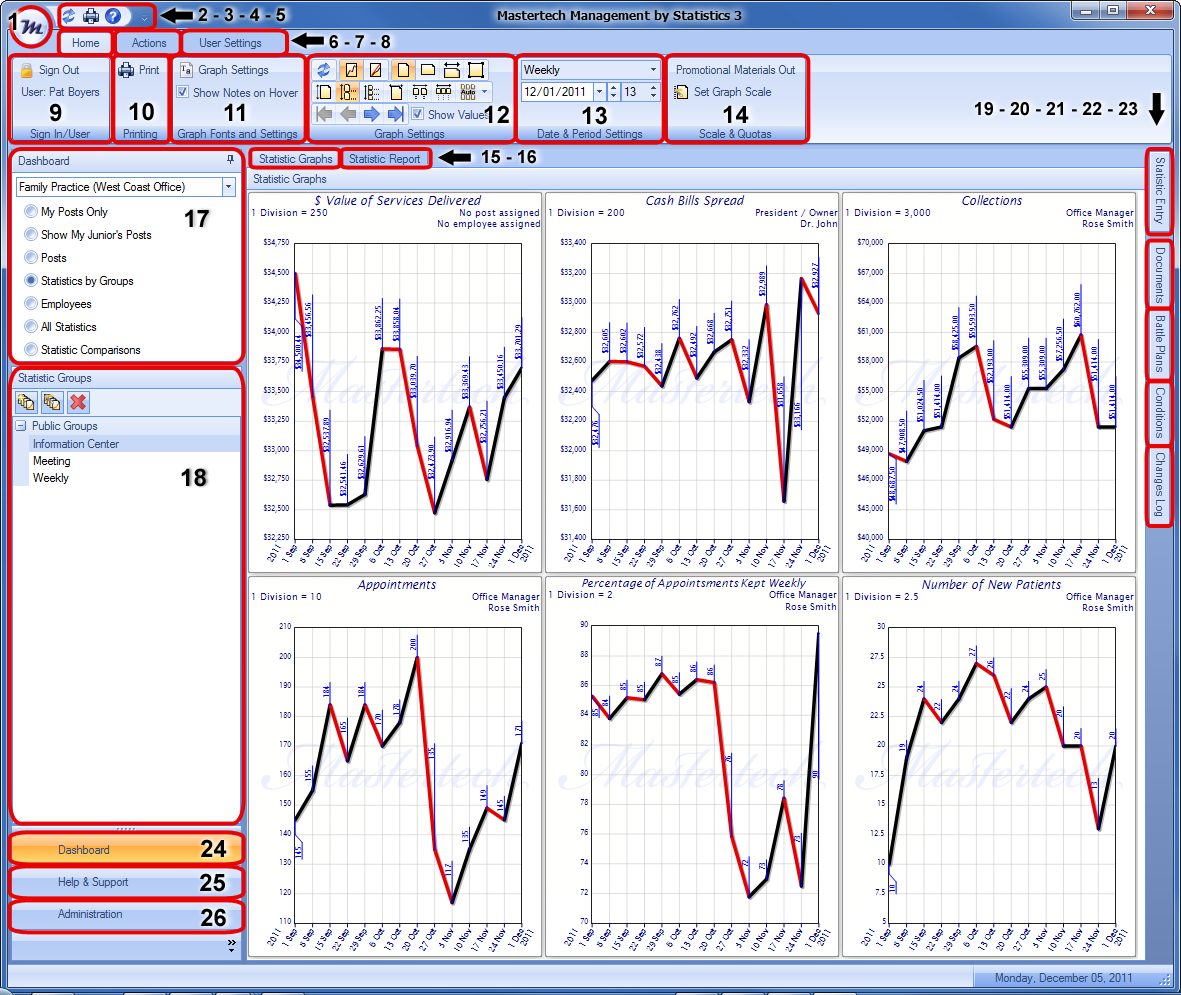
Management by Statistics 3 – Dashboard Layout Diagram
The following diagram shows each of the dashboard functions

-
| 1. | Management by Statistics Icon - when clicked there are several options: New - Refresh - Print - Sign-out - Exit |
-
| 2. | Refresh Button - refreshes current screen |
-
| 3. | Print Button - opens print options window |
-
| 4. | Help Button - opens help files in separate window |
-
| 5. | Customize Quick Access Toolbar Options Button |
-
| 6. | Home Tab - default user view |
-
| 7. | Actions Tab - selects to write new Condition Formula - Battle Plan - Document |
-
| 8. | User Settings Tab - customize Color scheme – change password - Database connection settings - ribbon display options |
-
| 9. | Sign In / Sign Out of the Software |
-
-
| 11. | Graph Fonts and Settings Section - check to show notes on hover – fonts and settings |
-
| 12. | Graph Settings Section - check to show values – refresh – change graph views |
-
| 13. | Date & Period Settings Section - change from daily, weekly, monthly, etc- change date |
-
| 14. | Scale & Quotas Section - click graph to select then set graph Quota |
-
| 15. | Statistic Graphs View Tab - select to display graphs |
-
| 16. | Statistic Report View Tab - select to display statistic reports |
-
| 17. | Dashboard Options Window - select a company from drop down menu and ... options |
-
| 18. | Dashboard Options Corresponding Window - list of items that correspond to the dashboard option clicked above |
-
| 19. | Statistic Entry Tab - enter all statistic values here |
-
| 20. | Documents Tab - list of documents |
-
| 21. | Conditions Tab - view past Condition Formulas |
-
| 22. | Battle Plans Tab - view past Battle Plans |
-
| 23. | Changes Log Tab - view logged changes |
-
| 24. | Dashboard Button - opens Dashboard view |
-
| 25. | Help & Support Button - opens Help & Support view |
-
| 26. | Administration Button - opens Administration view (only visible by an administrator) |